




You may think your data quality practices are working because your dashboards are green, reports reconcile, and monitoring alerts are firing correctly. But can you explain how data quality is actually measured, which thresholds define acceptable performance, who owns remediation, or how quality standards are enforced across systems?
That is the real governance gap. Modern data environments are too distributed for manual oversight, and as data moves across warehouses, APIs, SaaS applications, and AI systems, even a single defective record can quickly spread downstream.
This is exactly why data quality scorecards have become a critical part of enterprise governance.
What are data quality scorecards?
A data quality scorecard is a governance Framework that measures data reliability using scoring logic, thresholds, ownership models, and remediation workflows. Unlike dashboards that only visualize metrics, the data quality metrics scorecard determines whether datasets satisfy operational, analytical, and regulatory standards.
Mature scorecards evaluate multiple dimensions simultaneously, including accuracy, completeness, consistency, timelines, and integrity, because data failures really occur in isolation.
Ad data set me meet freshness SLAs while still violating referential integrity or cross-system consistency rules.
| Gartner estimates that poor data quality costs organizations an average of $12.9 million annually due to downstream operational failures and unreliable reporting. |
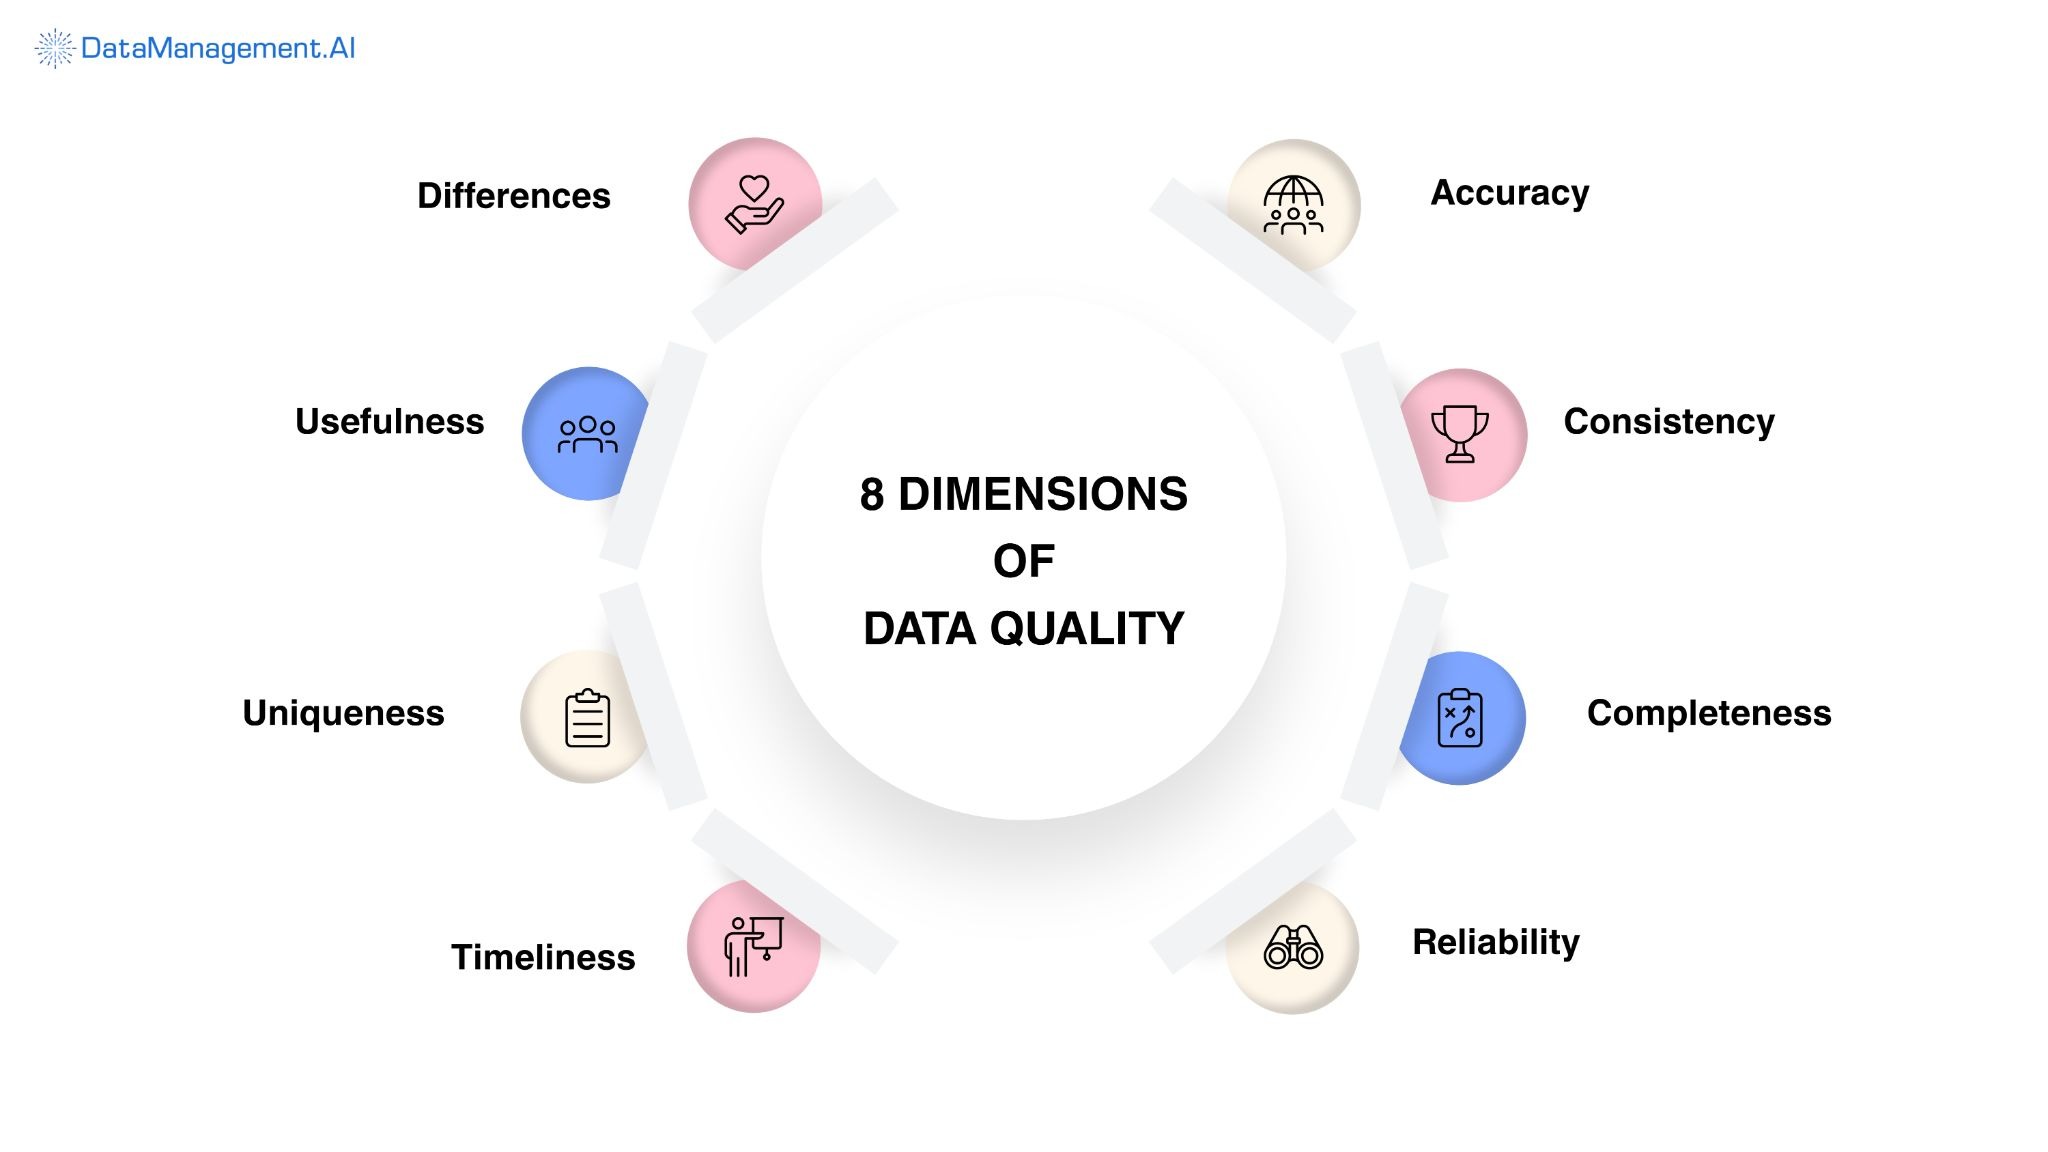
Which data quality dimensions should you actually measure?
Most organizations measure only what is easy to quantify, like null values, duplicate records, and schema validations. While these indicators are necessary, they fail to capture the true operational health of your data.
Your datasets may appear complete, yet contain inaccurate values, remain timely, but inconsistent across systems, or past validation, while being unfit for analytics, compliance, or AI.
So, in order to build a defensible data quality scorecard, you should continuously evaluate multiple quality dimensions like:
- Accuracy: Are your records correctly representing real-world entities, transactions, and business events?
- Completeness: Are all mandatory attributes, records, and reference values populated?
- Consistency: Do values remain synchronized across data warehouses, operational systems, APIs, and downstream applications?
- Timeliness: Is your data delivered within operational and regulatory SLA requirements?
- Integrity: Are relationships, referential constraints, and hierarchies preserved across domains?
- Validity: Does your data conform to schemas, business rules, regulatory standards, and approved formats?
- Reliability: Can stakeholders confidently use your data for reporting, forecasting, compliance, and AI-driven decision-making?
A failure in any single dimension propagates downstream, increasing reconciliation effort, degrading analytical accuracy, eroding trust, and exposing your organization to operational, regulatory, and financial risk.
Designing a defensible data quality scorecard framework
Most failed implementations make the same mistake: the teams prioritize dashboards before governance architecture. But the correct sequence always begins with governance modeling.
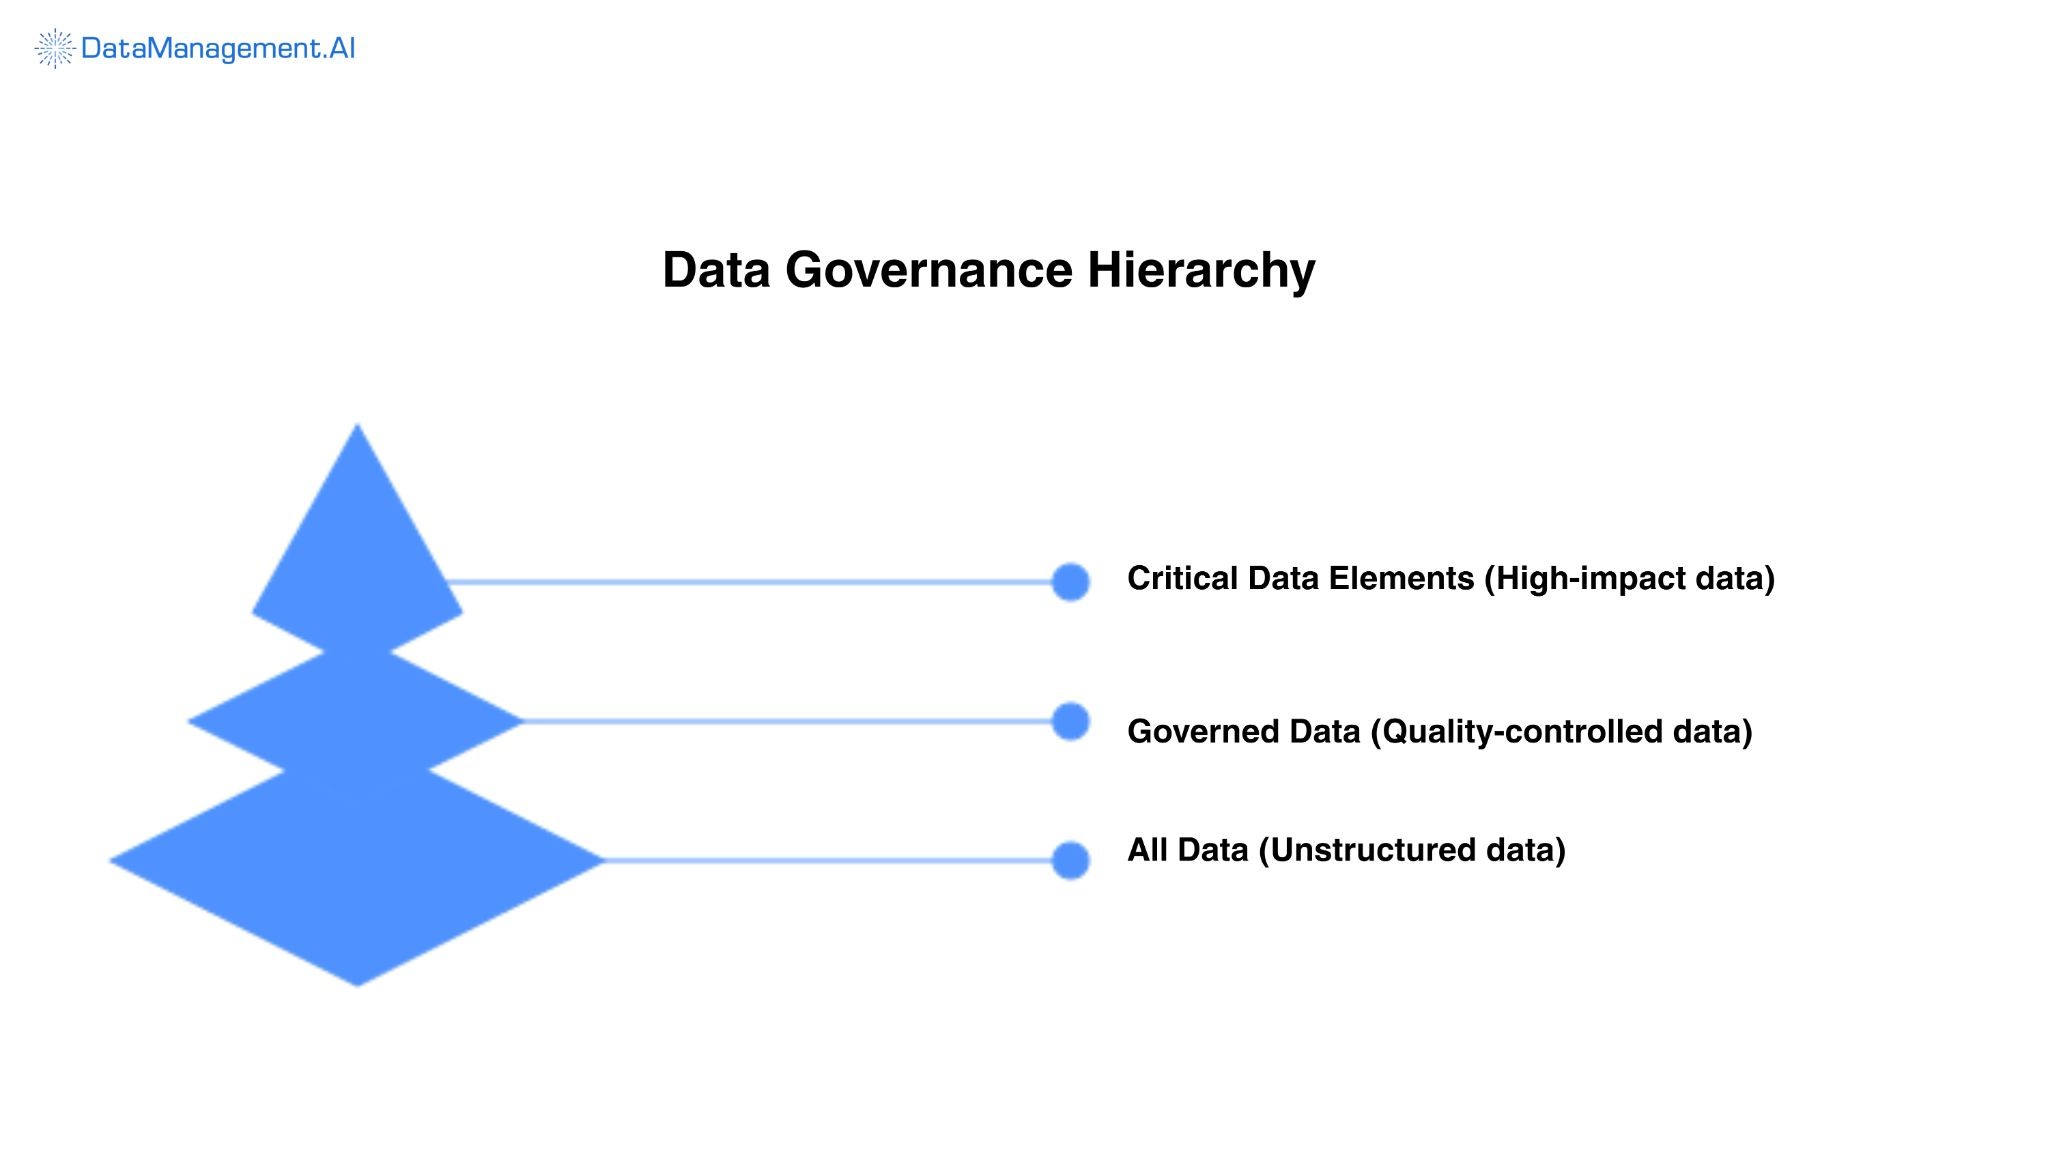
Identify critical data elements (CDEs)
Not every data set deserves the same level of governance enforcement. Mature organizations first-class critical data elements according to operational impact, compliance exposure, financial dependency, AI model sensitivity, and reporting criticality.
For example:
- AML transaction records required stricter thresholds than marketing clickstream events.
- Customer master tables received a higher governance priority than the telemetry logs.
- Financial reconciliation datasets demand lower error tolerance than internal analytics sandboxes.
A mature governance framework typically maps datasets according to:
- Revenue dependency
- Regulatory exposure
- SLA criticality
- Customer-facing risk
- Downstream AI consumption
- Operational recovery cost
This privatization directly influences scoring thresholds, remediation urgency, and escalation paths.
Define rules and Measurement logic
You should remember that a data quality metrics scorecard will only work when rules are explicit and measurable.
That’s why you should define validation rules like format checks, referential integrity constraints, and acceptable value ranges with utmost detail. Along with this, you should also establish clear profiling thresholds, so your teams know when deviations become risks.
Lastly, don’t forget to define exception handling processes in advance, including whether issues should be autocorrected, quarantined, or escalated.
Automate collection and scoring
In modern data environments, manual scoring is becoming obsolete. So, you should integrate measurement logic directly into ETL or ELT pipelines and orchestration layers.
Then, monitoring tools should continuously profile CDEs and calculate weighted scores, and your alert systems should convert failing metrics into operational incidents in real time.
Governance workflows and ownership
A data quality scorecard is only as effective as the governance model behind it. If no one owns a metric, no one is accountable when it degrades. Every metric should have a designated data steward, predefined escalation workflows for repeated threshold breaches, and a complete audit trail to support regulatory reviews, root cause analysis, and executive reporting.
A production-grade data quality scorecard should include:
- Quality dimensions: Measure the health of your critical data elements across accuracy, completeness, consistency, timelines, validity, integrity, and reliability.
- Performance metrics: Quantify each dimension using standardized percentages, weighted scores, or RAG indicators that enable executive-level monitoring.
- Thresholds and controls: Define risk-based tolerance limits that trigger alerts, remediation, workflows, or governance reviews before quality issues impact downstream operations.
- Exception management: Capture rule violations with severity, business impact, affected datasets, and root cause classification to accelerate remediation.
- Historical trend analysis: Track quality scores over time to identify systemic degradation, recurring failures, and the effectiveness of corrective actions.
- Ownership and remediation: Assign every issue to a named data steward with defined SLAs, escalation paths, and measurable remediation outcomes to ensure accountability.
Data quality scorecard examples, templates, and dashboard design
Designing a data quality scorecard becomes a much easier task when you can see what a “good” dashboard actually looks like.
I agree that the data in it is the most crucial part, but I’ll also have to remind you that even good data can appear useless if it lacks proper structure.
Data quality scorecard example – A tabular breakdown
Most data quality scorecards are present in a tabular format. Each row represents a critical data element, and each column reflects the defined data quality dimension.
So, the sample structure will include:
- Data element name
- Dimension (accuracy, completeness, etc.)
- Metric definition
- Current score (percentage or weighted value)
- Threshold indicator (green/amber/red)
- Owner
- Last updated timestamp
Data quality scorecard template
A template standardizes measurement across domains. It is different from the data quality scorecard example mentioned above, as it shows a filled-in instance for a specific dataset, whereas a template defines the reusable structural blueprint.
So, instead of rebuilding logic for every dataset, you can just reuse a consistent layout.
A typical layout contains:
- Data source name
- Critical data elements
- Data quality dimensions
- Rule definitions
- Scoring formula
- Threshold values
- Steward name
- Escalation path
The scoring formulas should also be explicit. For example: Score = (Valid records/Total records) x 100.
KPIs to track in your data quality scorecard
To make sure that your scorecard delivers actionable insights, you should track the following performance indicators along with the metrics mentioned above:
- Data downtime (DDT) – This measures incidents, detection time, and resolution time.
- Percentage of missing values – This will track gaps in important fields.
- Percentage of duplicate records – This will monitor redundancy across datasets.
- Invalid data rate – This will capture data that violates business rules.
- Table Uptime – This will ensure the availability and accessibility of datasets for users.
Implementing a data quality scoreboard correctly
If you are planning to roll out your data quality scoreboard, take a pause and go through this best practices list:
- Promote it properly
The scoreboard will be of no use if half of the company is unaware of its existence. So, share it via company emails, chat channels, all-hands meetings, or lunch and learn sessions.
- Collaborate across teams
When building a scoreboard, it is important that you make it look appealing and practical so that team members actually feel like using it.
For that, work with designers to make the visuals intuitive, involve developers to integrate the scoreboard into existing dashboards, and product managers to define measurable requirements.
- Keep stakeholders in the loop
To build trust, you should share progress, highlight improvements, and actively ask for feedback from your stakeholders.
- Iterate constantly
You should make sure that the scoreboard is relevant at all times by updating rules, KPIs, and thresholds as the data evolves.
- Automate wherever possible
If you have to manually keep a check on every aspect of the scoreboard, it will kind of kill its purpose. That’s why you should use automated pipelines and alerts to keep it live and accurate.
- Use the right tools
DataManagement.AI simplify monitoring, governance, and KPI tracking by automatically connecting to your data pipelines, applying validation rules, scoring critical data elements, and generating actionable dashboards.
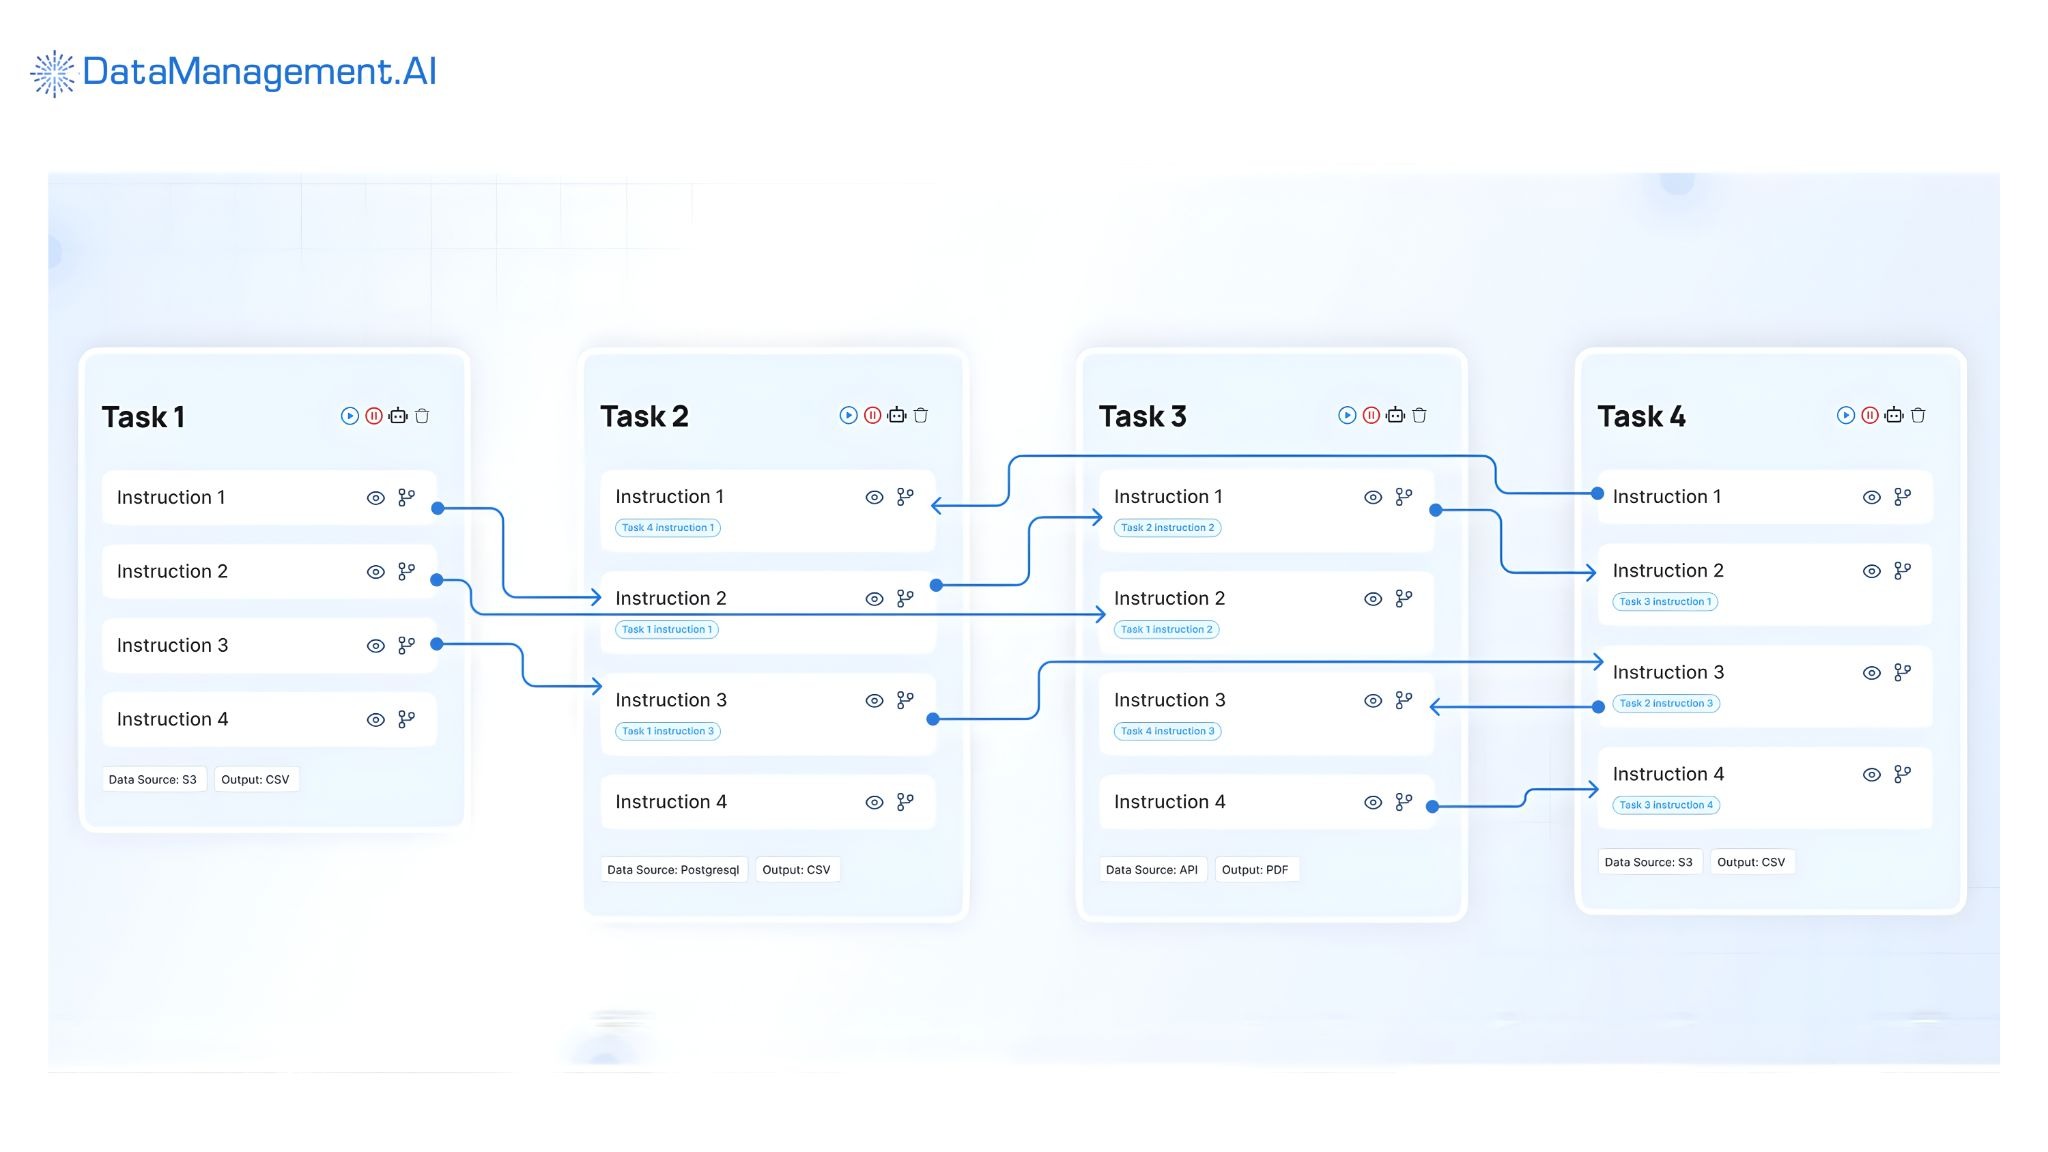
Thus, it will help keep your scorecard up-to-date in real time. Schedule a demo to know more.